
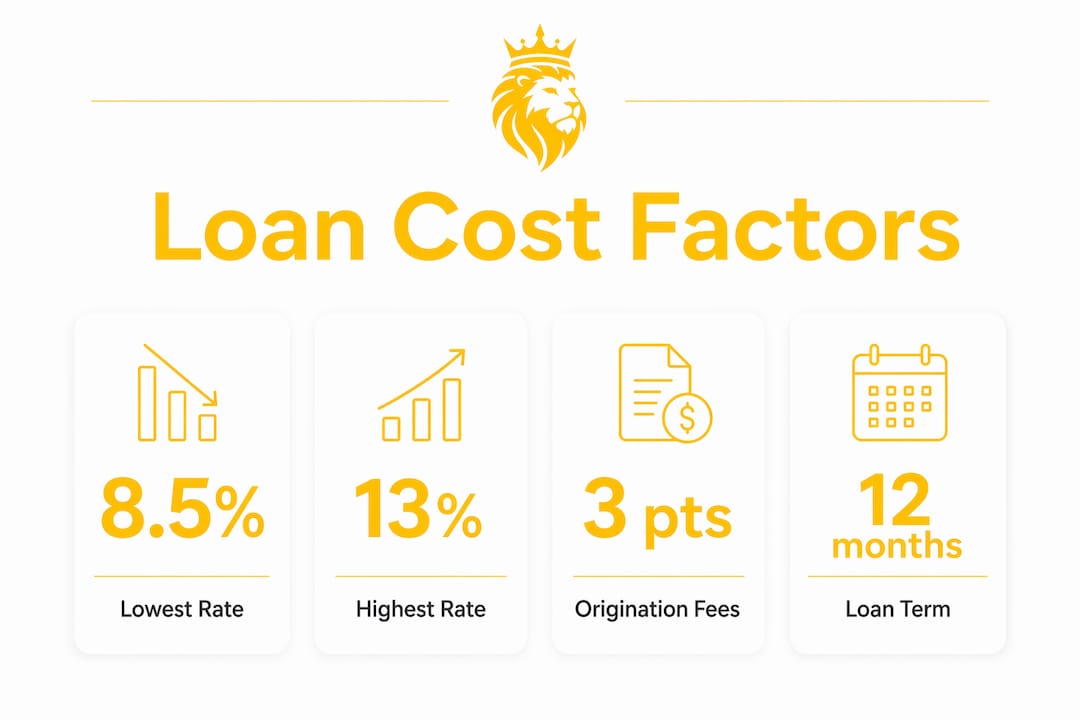
First-position hard money loan rates in the U.S. currently range from 8.5% to 13% annually, with second-position loans generally carrying higher rates of 12%–16%. Experienced borrowers with strong credit may access lower rates, while first-time investors or high-LTV deals tend to face rates toward the higher end. These figures represent the headline interest rate only. The actual cost of borrowing also includes origination points, processing fees, and inspection charges that can add meaningfully to the total expense.
Key cost components at a glance:
- Interest rate: 8.5%–13% annually for first-position loans
- Second-position loans: 12%–16% annually
- Origination points typically add a few percentage points to the loan cost, calculated as a percentage of the loan amount.
- Processing and document fees commonly add several hundred to a couple thousand dollars per transaction.
- Effective APR varies significantly depending on credit, experience, and loan term, often exceeding the nominal interest rate.
Rate snapshot: LTV ratios directly influence pricing. Loans at roughly 60% LTV typically secure rates 0.5%–1.5% lower than loans at 80% LTV on the same property.
Table of Contents
- How hard money loans work — and what they actually cost
- Weighing the advantages and trade-offs of hard money lending
- When does a hard money loan make sense for your investment?
- How to accurately evaluate and compare hard money loan offers
- What factors drive your hard money rate up or down?
- How market conditions shape current hard money rates
- Rate variation by scenario: what real deals look like
- Jaken Finance Group offers asset-based lending built for real estate investors
- Key Takeaways
How hard money loans work — and what they actually cost
Hard money loans are asset-based, short-term instruments secured by real property rather than borrower income or credit history. Loan terms typically run 6–18 months, with 12 months being the most common structure. Monthly payments are usually interest-only, with the full principal due as a balloon payoff at term end.
The headline interest rate is only the starting point for cost analysis. Origination points are paid at closing, before the project begins. On a $300,000 loan, two points means $6,000 out of pocket at the closing table, regardless of how long the loan runs. Add document preparation, underwriting, and draw fees ($150–$500 per rehab draw), and the total upfront costs can add 2%–5% to the effective six-month loan cost.
The table below illustrates how three different loan structures compare on a $250,000 loan held for 12 months:
| Feature | Scenario A (Low Rate) | Scenario B (Standard) | Scenario C (High Fee) |
|---|---|---|---|
| Interest Rate | 8.5% | — | 10.5% |
| Origination Points | 3.0% ($7,500) | — | — |
| Processing Fees | $2,000 | $1,200 | $900 |
| Total Upfront Cost | — | — | — |
| Total Interest Paid | — | — | — |
| Effective APR | — | — | — |
Scenario A carries the lowest stated rate yet ends up more expensive than Scenario B once points and fees are factored in. Annual Percentage Rate, which accounts for interest, points, and fees over the loan term, is the only metric that allows a fair comparison across lenders.
Additional cost components to track:
- Extension fees may apply if the project runs past the original term, typically calculated as a fraction of the loan amount.
- Prepayment penalties: typically none on fix-and-flip programs
- Draw fees: $150–$500 per rehab disbursement
- Minimum down payment requirements vary depending on loan-to-value ratio and lender policies.
Weighing the advantages and trade-offs of hard money lending
Hard money loans close quickly based on property value rather than borrower creditworthiness, which is their primary structural advantage over conventional financing. A deal that would take 30–45 days to close through a bank can often close in 7–10 days through a private lender, and sometimes faster.
Advantages:
- Speed of funding, often 7–10 days from application to close
- Asset-based underwriting with minimal credit requirements
- Flexibility on property condition, including distressed or non-warrantable assets
- Access to deals that conventional lenders will not touch
Disadvantages:
- Interest rates of 8.5%–13% plus 1.5–3 origination points exceed conventional loan costs
- Short terms of 6–18 months create refinance or sale pressure
- Upfront fees are non-refundable regardless of project outcome
- Borrower experience directly affects pricing: first-time flippers typically pay 13%–15% interest with 2–3 points, while repeat borrowers with three to five completed projects can negotiate down to 10%–12% with 1–2 points
The higher cost is frequently justified by deal access and timing. A property acquired at a discount that generates a strong margin on resale can absorb the financing premium. The risk concentrates in projects where margins are thin and timelines extend beyond the original term.
When does a hard money loan make sense for your investment?
Hard money financing fits a specific set of investment scenarios where speed, flexibility, or property condition rules out conventional lending. Fix-and-flip projects are the most common use case: the investor acquires a distressed property, renovates it, and sells within the loan term. The short duration aligns with the business model, and the asset-based underwriting accommodates properties that banks will not finance in their current condition.
Scenarios where private money loan rates are worth paying:
- Fix-and-flip acquisitions requiring fast closings to beat competing offers
- Bridge financing between the sale of one property and the purchase of another
- New construction projects with defined completion timelines
- BRRRR strategy deals where the investor plans to refinance into a DSCR loan at stabilization
- Auction purchases requiring same-week or next-week funding
Scenarios where hard money is a poor fit:
- Long-term buy-and-hold strategies where carrying costs erode cash flow
- Projects with uncertain timelines that risk triggering extension fees
- Deals with thin margins that cannot absorb 12%–18% effective APR
- Investors without sufficient liquidity for purchase costs, rehab overruns, and closing fees
Liquidity is a consistent pressure point. Hard money loans rarely cover 100% of total project costs despite advertised maximum LTC or ARV percentages. Investors need reserves for overruns, carrying costs during the hold period, and the gap between the loan amount and total project spend. Understanding LTV mechanics before committing to a deal structure prevents costly surprises mid-project.
How to accurately evaluate and compare hard money loan offers
APR is the correct unit of comparison, not the headline interest rate. A lender offering 10% with 3 points is often more expensive than one offering 11% with 1 point, particularly on short-term projects where upfront fees compress into a narrow window.
Pro Tip: Non-prorated points are the most common cost trap novice investors miss. If you pay 2 points upfront for a 12-month loan and sell the property in 4 months, you paid for 12 months of access but used only 4. Always ask whether the lender offers pro-rated points or a reduced-point structure for fast turnarounds. Some lenders will accept a slightly higher interest rate in exchange for lower origination fees, which saves money on short holds.
Evaluation criteria for comparing loan offers:
- Calculate total cost of funds: upfront fees plus total interest over the projected hold period
- Compare effective APR across all offers using the same projected term
- Confirm whether points are pro-rated or fixed regardless of payoff date
- Identify all fees: processing, underwriting, draw, inspection, and extension
- Assess lender flexibility on extensions if the project timeline slips
- Review prepayment terms to confirm no penalty for early payoff
Repeat borrowers hold real negotiating leverage. Lenders price risk, and a borrower with a documented track record of on-time payoffs and profitable exits represents lower risk. Volume and velocity matter: investors who close multiple deals per year with the same lender often secure better pricing than one-time borrowers. A loan proposal checklist that accounts for all fee categories prevents the common mistake of comparing only stated rates.
What factors drive your hard money rate up or down?
Hard money lenders price each loan based on a combination of borrower profile, property characteristics, and deal structure. No single factor determines the rate in isolation.

Borrower creditworthiness: FICO scores influence pricing even in asset-based lending. Lenders use credit as a secondary signal of borrower reliability. A score above 700 typically unlocks better terms; scores below 600 push rates toward the upper range or trigger additional requirements. Experience compounds the effect: a borrower with five completed flips and a 680 FICO will often outprice a first-timer with a 750 FICO.
Property type and condition: Single-family residential properties in stable markets carry the lowest risk premium. Multi-family, mixed-use, and commercial assets attract higher rates due to complexity and longer disposition timelines. Severely distressed properties or those in declining markets add another layer of lender risk, reflected in the rate.
LTV and ARV: Lower LTV loans give lenders more collateral cushion. A loan at 60% LTV typically prices 0.5%–1.5% lower than a comparable loan at 80% LTV. Many lenders also cap leverage at 70%–75% of after-repair value, and deals that push those limits price accordingly. Investors can review how borrower experience affects terms to understand how lenders weight these variables together.
Lender risk appetite: Not all private lenders operate with the same capital cost or risk tolerance. Regional lenders focused on specific markets may offer sharper pricing on local deals than national platforms. Relationship history with a specific lender consistently produces better terms than approaching a new lender cold.
How market conditions shape current hard money rates
Hard money rates do not move in isolation from broader credit markets. Private lenders fund their loan pools through capital partners, institutional investors, and their own balance sheets, all of which carry a cost tied to prevailing interest rate environments.
When the Federal Reserve raises benchmark rates, the cost of capital for private lenders increases, and that cost passes through to borrowers. The rate environment of 2022–2024 pushed hard money rates meaningfully higher than the pre-2022 baseline. As of mid-2026, first-position rates in the 8.5%–13% range reflect a market that has stabilized but not returned to the lower floors seen before the rate cycle began.
Real estate market conditions in specific geographies also affect pricing. High-demand markets with fast absorption rates and strong ARV comps reduce lender risk, which can translate to more competitive terms. Conversely, markets with softening values or extended days-on-market increase lender caution and push rates higher. Investors operating in secondary or tertiary markets should expect to pay a premium relative to primary metro deals, all else being equal.
Rate variation by scenario: what real deals look like
The spread between the best and worst hard money pricing is wide enough to materially affect project profitability. Three representative scenarios illustrate how different borrower and deal profiles translate into actual rate structures.
Scenario 1: Experienced investor, low LTV, primary market. A borrower with eight completed flips, a 720 FICO, and a deal at 62% LTV in a high-demand metro can realistically access rates at the lower end of the current range, around 8.5%–9.5% with 1–1.5 points. Total effective APR on a 9-month hold lands in the 11%–12% range.

Scenario 2: Mid-tier borrower, standard LTV, suburban market. An investor with two prior flips, a 660 FICO, and a deal at 72% LTV in a suburban market will typically see rates of 10.5%–12% with 2–2.5 points. Effective APR on a 12-month hold runs 13%–15%.
Scenario 3: First-time investor, high LTV, distressed asset. A first-time borrower with no track record, a 620 FICO, and a deal at 78% LTV on a heavily distressed property faces rates of 13%–15% with 2.5–3 points. Effective APR can reach 16%–18%, and some lenders will decline the deal outright. Reviewing key facts about hard money loans before approaching lenders helps first-time borrowers understand what documentation and deal structure will improve their position.
The gap between Scenario 1 and Scenario 3 can exceed $15,000 in financing costs on a $300,000 project. Building experience, maintaining credit, and structuring deals at conservative LTV ratios are the most direct paths to accessing the lower end of the rate range.
Jaken Finance Group offers asset-based lending built for real estate investors
Real estate investors who need fast, flexible financing without the credit-score barriers of conventional lending have a direct path through Jaken Finance Group. The firm specializes in hard money, fix-and-flip, bridge, new construction, and DSCR rental loans nationwide, with closings available in as few as five days. Underwriting focuses on the property's value and deal structure rather than FICO scores, which means investors with varying credit profiles can access capital when a deal requires speed.
Jaken Finance Group works with both first-time and experienced investors, offering gap financing, second-position loans, and deferred payment structures that address the liquidity gaps common in active portfolios. The firm's free loan calculators and investor guides give borrowers a clear picture of total financing costs before they commit. For investors ready to move on a deal, apply for hard money financing directly through Jaken Finance Group's platform, or explore no credit check loan options for asset-based deals where property value drives the decision.
Key Takeaways
Hard money loan rates in 2026 range from 8.5% to 13% for first-position loans, but effective APR including points and fees typically runs 12%–18%, making total cost calculation more important than headline rate comparison.
| Point | Details |
|---|---|
| Current rate range | First-position loans run 8.5%–13% annually; second-position loans run 12%–16%. |
| Origination points add cost | Points of 1.5–3 at closing raise effective APR well above the stated interest rate. |
| LTV drives pricing | Loans at ~60% LTV typically price 0.5%–1.5% lower than loans at ~80% LTV. |
| Experience lowers your rate | First-time flippers pay 13%–15% with 2–3 points; repeat borrowers negotiate 10%–12% with 1–2 points. |
| Jaken Finance Group | Offers asset-based hard money and fix-and-flip loans nationwide with closings in as few as five days. |