
Commercial bridge loan rates in 2026 range from 9.00% to 14.00% all-in, depending on asset class, lender type, and borrower profile. These short-term instruments, formally called bridge financing or interim loans, fill the gap between acquisition and permanent debt. The base rate today is SOFR at approximately 3.68%, with lender spreads adding 470 to 970 basis points on top. Institutional lenders price at the lower end of that range, while private debt funds and hard money lenders price higher to reflect faster execution and looser underwriting standards. Jakenfinancegroup operates in this space with asset-based lending that prioritizes property value over credit scores, closing deals in as few as five days.
What factors determine commercial bridge loan rates?
Four variables drive bridge loan pricing more than any others: loan-to-cost ratio, borrower track record, property type, and exit strategy clarity. Understanding each one gives you real negotiating leverage with lenders.
Loan-to-cost and loan-to-value ratios are the most direct pricing levers. Leverage typically maxes at 70–75% LTC, including construction costs. Borrowers who request 65% LTC or below consistently receive tighter spreads because the lender holds more equity cushion. Pushing toward 75% LTC on a heavy-lift project moves you toward the 13%–14% end of the range.
Borrower experience and sponsor profile carry significant weight in underwriting. Experienced borrowers with clear exit strategies secure rates at the lower end of the 9%–14% range. A first-time sponsor on a hotel conversion faces a materially different spread than a developer with 20 completed multifamily projects. Lenders price for execution risk, not just credit risk.

Property type also shifts pricing. Multifamily and industrial assets typically attract the tightest spreads because of predictable cash flow and deep buyer markets. Office and hospitality assets carry wider spreads due to higher vacancy risk and longer stabilization timelines. Ground-up construction commands the highest rates within any lender category.
Exit strategy is the factor most borrowers underestimate. Having a pre-qualification letter from a permanent lender, such as a CMBS conduit or life insurance company, directly improves underwriting outcomes and can lower your rate. Lenders price for uncertainty. Remove the uncertainty, and the spread compresses.
- LTC below 65%: strongest pricing position
- Multifamily or industrial asset class: tighter spreads
- Sponsor with 5+ completed projects: lower rate tier
- Pre-qualified permanent exit: measurable rate reduction
- Heavy construction or office: expect upper range pricing
Pro Tip: Before approaching any lender, prepare a one-page sponsor track record sheet listing completed projects, exit outcomes, and current portfolio. This single document can move your quoted rate by 50 to 100 basis points.
How do different bridge loan types compare on rates and terms?
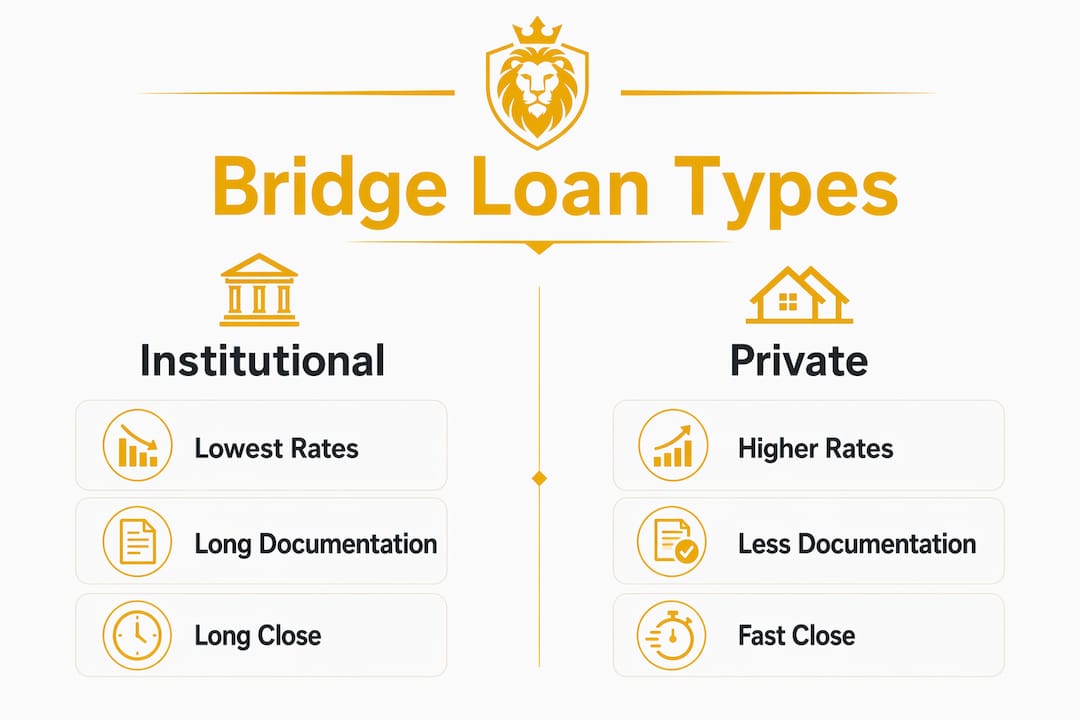
Bridge loan underwriting focuses on the asset and business plan rather than personal credit, which is why rate variation across lender categories is so wide. The three primary categories are institutional bridge, private debt fund bridge, and hard money bridge.
| Loan Type | Rate Range | Origination Points | Max LTC | Typical Term |
|---|---|---|---|---|
| Institutional bridge | 8.00%–11.50% | 0.5–1.5 pts | 70–75% | 24–36 months |
| Private debt fund | 10.00%–13.00% | 1–3 pts | 70–75% | 12–24 months |
| Hard money bridge | 11.00%–14.00% | 2–4 pts | 65–70% | 12–18 months |
Institutional lenders offer the lowest all-in cost but require more documentation and longer close timelines. Typical closing times for asset-based bridge loans run 5–14 days at the hard money end, compared to 30–60 days for institutional execution. That speed differential has real value when you are competing for a time-sensitive acquisition.
All three categories structure loans as interest-only with a balloon payoff at maturity. This keeps monthly debt service low during the hold period, which matters when a property is not yet stabilized. Bridge loan terms span 12 to 36 months, with extensions available at additional cost.
Common fees across all bridge loan categories include:
- Origination points: 1 to 4 points paid at closing
- Exit fees: 0.5 to 1 point paid at payoff, common in private and hard money deals
- Extension fees: 0.25 to 0.5 points per extension period, typically 3 to 6 months
- Interest reserve: 3 to 6 months of interest held in escrow at closing
Fixed-rate bridge loans exist but are less common. Most bridge loans float over SOFR, meaning your rate adjusts as SOFR moves. With SOFR at 3.68% today, a 500-basis-point spread produces a 8.68% rate. A 700-basis-point spread produces 10.68%. Knowing the spread, not just the quoted rate, is how you compare lenders accurately.
Pro Tip: Always ask lenders for the spread over index, not just the all-in rate. If SOFR moves 50 basis points during your loan term, a floating-rate loan at a 500-basis-point spread costs you less than a fixed-rate loan locked at 11.00%.
For a detailed breakdown of how bridge loans differ from hard money products, the distinctions in underwriting and pricing are worth reviewing before you select a lender category.
What hidden costs push the true rate above the headline number?
The quoted interest rate is not the total cost of capital. Origination fees, exit fees, and interest reserves can add hundreds of basis points beyond the stated rate. Most borrowers who focus only on the headline rate underestimate their actual financing cost by a meaningful margin.
Consider a $5,000,000 bridge loan at 10.50% with 2 origination points, a 0.75% exit fee, and a 4-month interest reserve. The 2 points cost $100,000 upfront. The exit fee costs $37,500 at payoff. The interest reserve removes $175,000 from your available proceeds at closing. On an 18-month hold, the effective annualized cost of capital exceeds the stated 10.50% by 150 to 200 basis points.
Calculating DSCR under stressed rates is the correct way to model debt service risk. Use a rate 100 to 150 basis points above your current floating rate to stress-test your cash flow. If the project cannot service debt at a stressed rate, the loan structure carries more risk than the headline number suggests.
Key cost components to model before signing a term sheet:
- All-in origination cost: points plus any lender legal fees
- Exit fee: often buried in the loan agreement, not the term sheet summary
- Interest reserve: reduces net proceeds; factor this into your equity requirement
- Prepayment penalty: some lenders charge a yield maintenance fee for early payoff
- Extension fee: plan for at least one extension; budget the cost upfront
Holding bridge debt beyond stabilization is one of the most common and costly mistakes in commercial real estate. Overpayment on cost of capital can reach 2%–4% annually compared to permanent debt. Every month you stay in bridge financing past your planned exit date erodes project IRR directly.
Pro Tip: Build your extension fee into the base case underwriting, not the downside scenario. Delays happen. If you model the extension cost from day one, you will not be surprised by it at month 18.
Jakenfinancegroup structures its bridge loan products with transparent fee disclosure so investors can model total cost of capital accurately before committing.
How can investors use commercial bridge loans effectively?
Bridge financing works best as a short-term tool with a defined exit. The four most common use cases are acquisition speed, value-add repositioning, lease-up financing, and recapitalization of existing assets. Each requires a different approach to loan sizing, term selection, and exit planning.
-
Acquisition speed: When a seller requires a 10-day close, institutional financing cannot compete. Asset-based lenders close in 5–14 days by underwriting the property, not the borrower's tax returns. This speed premium justifies the higher rate when the deal economics support it.
-
Value-add repositioning: A multifamily property at 60% occupancy does not qualify for agency debt. A bridge loan funds the acquisition and renovation, then the stabilized asset refinances into a DSCR loan or agency product. The bridge loan is the means to reach permanent financing eligibility, not the end state.
-
Lease-up financing: Office and retail acquisitions with below-market occupancy require time to stabilize. Bridge loans provide the runway. The key is sizing the loan so that projected stabilized NOI supports a permanent loan large enough to pay off the bridge balance.
-
Recapitalization: Investors with equity trapped in a stabilized asset can use a bridge loan to pull capital out quickly while a longer-term refinance is processed. This is common when a CMBS loan is in process and the borrower needs liquidity now.
-
New construction takeout: Ground-up construction loans often convert to bridge financing at certificate of occupancy while the property leases up. The bridge period typically runs 12 to 18 months before permanent debt is placed.
Selecting the right lender category depends on your timeline and risk profile. If you have 45 days and strong documentation, institutional pricing saves money. If you have 10 days and a complex asset, hard money execution is the correct tool. The SBA-to-bridge financing sequence is another structure worth understanding for owner-occupied commercial acquisitions.
Pre-qualification from a permanent lender before you close your bridge loan is the single most effective way to control total financing cost. It shortens the bridge period, reduces extension risk, and signals execution credibility to your bridge lender.
Key Takeaways
Commercial bridge loan rates range from 9.00% to 14.00% all-in, and the total cost of capital always exceeds the headline rate once fees, reserves, and extensions are factored in.
| Point | Details |
|---|---|
| Rate range in 2026 | All-in rates span 9.00%–14.00% depending on lender type, LTC, and asset class. |
| SOFR base drives pricing | Lender spreads of 470–970 basis points over SOFR determine your actual rate. |
| Total cost exceeds stated rate | Origination points, exit fees, and interest reserves add 150–200 basis points to effective cost. |
| Exit strategy lowers your rate | A permanent lender pre-qualification letter improves underwriting and compresses spreads. |
| Speed has a price | Hard money lenders close in 5–14 days but price 200–300 basis points above institutional lenders. |
What I've learned about pricing bridge loans in 2026
The most consistent mistake I see investors make is treating the quoted rate as the cost of the loan. It is not. The rate is one input. The origination points, the exit fee, the interest reserve, and the extension fee are the other inputs. Add them all together before you compare lenders. A lender quoting 10.00% with 3 points and a 1% exit fee is more expensive than a lender quoting 11.00% with 1 point and no exit fee on an 18-month hold.
The 2026 market is more stable than 2023 or 2024. Rates have dropped 150–200 basis points from their 2024 peaks, and lender competition has returned in most asset classes. That stability is good for borrowers, but it also creates a false sense of security. Borrowers are shopping rate again instead of shopping structure. Structure matters more.
The investors I see execute best are the ones who walk into a lender conversation with three things ready: a clear business plan, a defined exit with lender pre-qualification, and a sponsor track record that removes execution doubt. Those three elements do more to lower your rate than any amount of negotiation on the spread. Lenders price for risk. Reduce their perceived risk, and the price follows.
One more observation: lender segmentation has sharpened. Institutional bridge lenders have pulled back from heavy-lift construction and office assets. Private debt funds have filled part of that gap. Hard money lenders remain the fastest execution option for complex or time-sensitive deals. Know which segment fits your deal before you start making calls. Sending a ground-up construction deal to an institutional bridge lender wastes time you may not have.
— Jason
Financing your next acquisition with Jakenfinancegroup
Real estate investors who need fast, flexible financing without the friction of traditional underwriting have a direct path forward with Jakenfinancegroup.
Jakenfinancegroup provides asset-based bridge loans nationwide, with closings in as few as five days. Underwriting focuses on the property's value and the investor's business plan, not credit scores or tax return history. That approach works for acquisitions, value-add projects, new construction, and recapitalizations across all major asset classes. Investors with varying financial profiles qualify because the asset does the heavy lifting in underwriting. For investors who need capital without a credit check, no-credit-check hard money options are also available. Contact Jakenfinancegroup to discuss your project and get a term sheet that reflects your deal's actual structure.
FAQ
What is the current range for commercial bridge loan rates?
Commercial bridge loan rates currently range from 9.00% to 14.00% all-in as of mid-2026. Institutional lenders price at 8.00%–11.50%, while private and hard money lenders range from 10.00%–14.00%.
How is a bridge loan interest rate calculated?
Bridge loan rates are calculated as a lender spread plus a base index, typically SOFR. With SOFR at approximately 3.68%, spreads of 470 to 970 basis points produce all-in rates between roughly 8.38% and 13.38%.
What fees add to the total cost of a bridge loan?
Origination points (1–4 points), exit fees (0.5–1 point), extension fees, and interest reserves all increase the effective cost beyond the stated rate. These additions can raise your true cost of capital by 150–200 basis points above the headline rate.
How long do commercial bridge loans typically last?
Bridge loan terms typically run 12 to 36 months and are structured as interest-only with a balloon payoff at maturity. Extensions of 3 to 6 months are available but carry additional fees.
What is the fastest way to close a commercial bridge loan?
Asset-based hard money lenders close commercial bridge loans in 5–14 days by underwriting the property rather than the borrower's financial history. This speed comes at a higher rate compared to institutional lenders, which require 30–60 days to close.